
Campaign data
A clean table for date, channel, campaign, spend, impressions, clicks, leads, customers and revenue.
Free Excel template
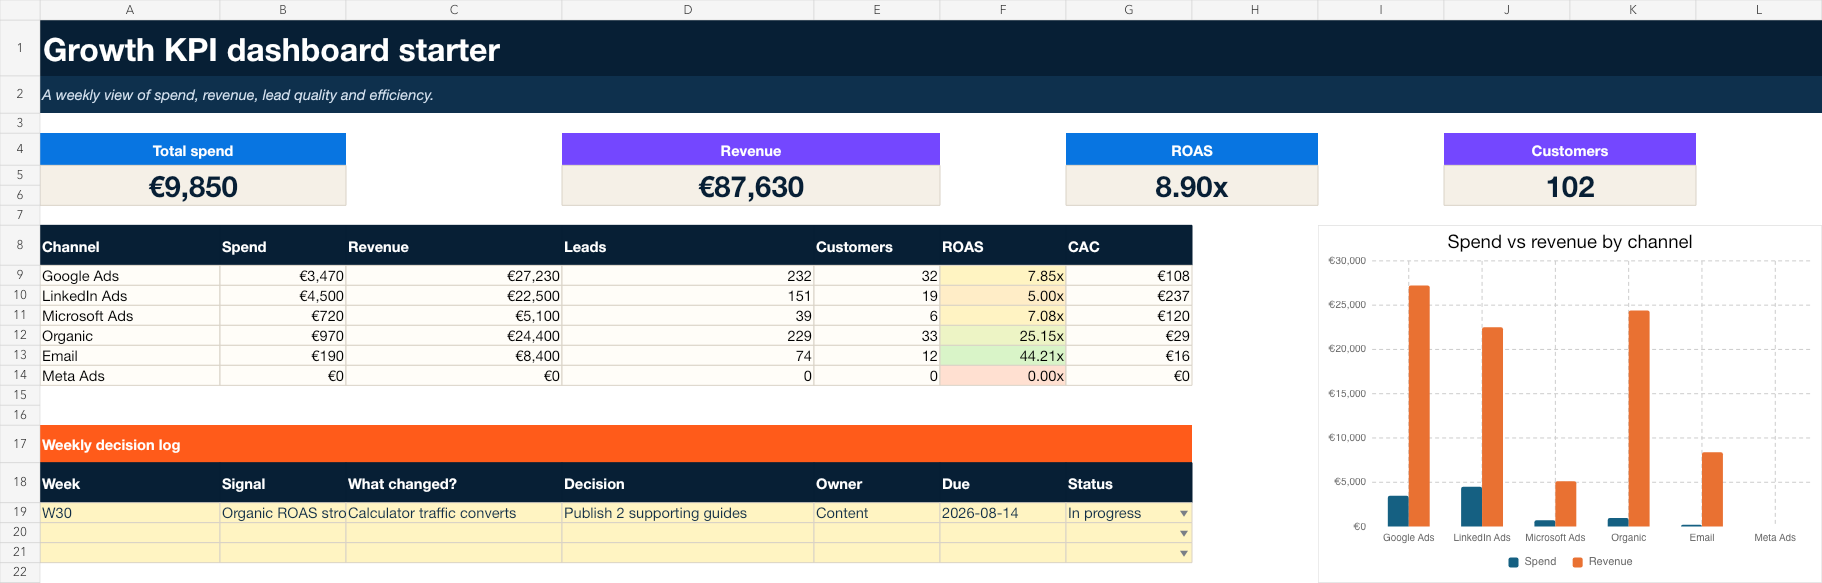
Track spend, revenue, leads, customers, ROAS and CAC by channel. Then record what your team will change next.
 Formula-driven · Sample data included · Fully editable
Download the starter
Replace the yellow sample cells with your own campaign data. The KPI cards, channel table and chart update automatically.
Created by Sina Dadmehr · Samsina, UtrechtInside the workbook
A clean table for date, channel, campaign, spend, impressions, clicks, leads, customers and revenue.
Formula-driven totals and channel comparisons for ROAS, CAC, volume, spend and revenue.
A simple space for the signal, decision, owner, due date and status—so reporting leads to action.
Why these metrics
Platform dashboards are useful for delivery. This workbook creates one cross-channel view using the definitions your team chooses.
Dashboard questions
Yes. The Starter workbook costs €0. Enter your email so the site can generate a protected download link. Newsletter consent is separate and optional.
The file is an .xlsx workbook designed for Microsoft Excel. It can also be imported into Google Sheets, although chart styling may look slightly different.
Spend, revenue, leads, customers, ROAS and CAC are calculated by channel. A weekly decision log connects the numbers to an owner and next action.
No. You edit the downloaded file locally. Samsina receives only the delivery email and the optional marketing-consent choice submitted on this page.
Need deeper planning?
Explore the paid toolkits when the Starter dashboard is not enough.